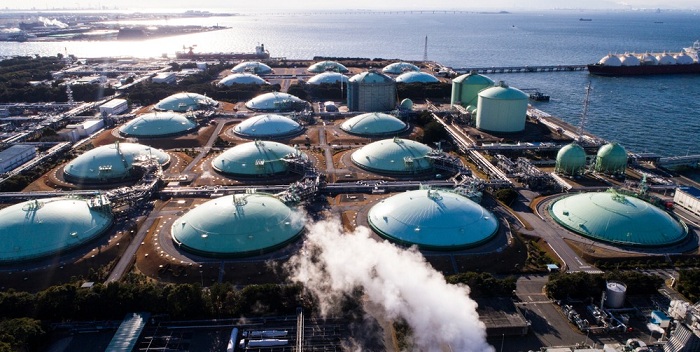
LNG hits a record, then hits turbulence: Inside the 2026 World LNG Report
The global LNG market just closed out its strongest year since 2022, only to sail straight into one of the most disruptive geopolitical shocks the industry has ever faced. That’s the picture painted by the International Gas Union’s 2026 World LNG Report, produced with Rystad Energy: a business that broke records in 2025 and then, within weeks of the new year starting, watched a Gulf conflict take a chunk of global supply off the map.
Here’s what the numbers say — and what they mean for the rest of the decade.
2025: A Record-Breaking Year for Trade
Global LNG trade climbed to 436.98 million tonnes in 2025, up 6.3% year-on-year and the fastest growth rate since 2022. Twenty-four exporting markets shipped cargo to 50 importing markets, and two brand-new suppliers — Canada and the joint Mauritania/Senegal project — made their debuts.
The headline story was North America’s surge. US exports jumped by more than 22 million tonnes to overtake every other supplier, pushing total American output to 110.7 million tonnes — a quarter of the entire global market. Qatar held on to second place at 81.5 million tonnes, with Australia close behind at 80.3 million tonnes. Together, the top three suppliers now account for well over half of everything the world ships.
On the buying side, the big swing was Europe’s return as a demand engine. European imports jumped 26 million tonnes to 126.2 million tonnes as the region replaced the last of its Russian pipeline gas and rebuilt storage. China, by contrast, pulled back sharply — down almost 9 million tonnes — thanks to a mild winter, rising domestic gas output, and more pipeline supply from Russia.
Then the Gulf Erupted
Just as producers were gearing up for another year of expansion, the picture changed. Escalating conflict between Israel, Iran, and the wider Gulf culminated in the temporary closure of the Strait of Hormuz — the corridor through which Qatari and Emirati LNG has always flowed to reach world markets.
The consequences were immediate and severe:
· Qatar and the UAE, representing roughly 16% of the world’s operating liquefaction capacity, were effectively cut off from global buyers.
· Iranian missile strikes damaged two liquefaction trains at Qatar’s flagship Ras Laffan complex, knocking out 12.8 million tonnes per year of capacity — about 17% of Qatar’s nameplate output — for an expected three to five years.
· QatarEnergy declared force majeure on multiple supply contracts.
· Spot prices spiked violently: the Asian JKM benchmark rocketed nearly 70% to over $25/MMBtu by early March, its highest level since December 2022, while East-of-Suez shipping rates briefly hit $300,000 a day.
Unlike previous crises — the Fukushima accident or the Russia-Ukraine war — which restricted competing energy sources and boosted LNG demand, this shock hit the supply side directly, triggering real demand destruction in Asia and Europe as buyers scrambled for alternatives.
Still, the report is careful to note the market’s resilience. A more diversified, more liquid trading system — with spot and short-term deals now making up roughly 40% of volumes — helped absorb the shock better than the market managed during the 2022 energy crisis.
Liquefaction: Investment Keeps Flowing Despite the Risk
Even with the Gulf turmoil, the underlying investment story stayed strong through 2025. Global liquefaction capacity grew by 30.1 million tonnes to reach 524.5 million tonnes per year, driven by new trains at Plaquemines and Corpus Christi in the US, the launch of LNG Canada, and Mauritania/Senegal’s first floating LNG cargo.
Final investment decisions hit 68.4 million tonnes for the year — the highest since 2019 — with US Gulf Coast projects like Woodside Louisiana LNG, Calcasieu Pass 2, and Port Arthur Phase 2 dominating the list. That caps a five-year investment run from 2021–2025 that sanctioned over 200 million tonnes of new capacity, roughly double the pace of the previous five years.
Floating LNG (FLNG) technology also came of age, with global floating capacity reaching 16.6 million tonnes and a further 172 million tonnes of FLNG projects proposed — reflecting growing appetite for offshore solutions that sidestep onshore security risks, particularly in Mozambique.
Shipping: Oversupplied, Then Whiplashed
The tanker market told a similar before-and-after story. Through most of 2025, the LNG carrier fleet — which grew 8.4% to 804 active vessels — expanded faster than trade itself, leaving the market oversupplied and freight rates historically weak. Modern vessels often barely covered operating costs.
Then came the Hormuz closure. East-of-Suez charter rates, which had languished around $14,000 a day in early February, spiked to $300,000 a day by early March before settling near $100,000 — still well above pre-crisis levels by late April.
Regasification: Racing to Diversify
Import infrastructure kept expanding too, with global regasification capacity reaching 1,113.5 million tonnes per year across 50 markets. China led new construction, but Egypt and Senegal stood out for adding floating storage and regasification units (FSRUs) at pace — Egypt alone added nearly 15 million tonnes of new import capacity as it flipped from LNG exporter to major importer.
What Comes Next: A Decade of “Delayed, Not Cancelled”
The report’s central thesis for the years ahead is that 2026’s crisis will delay the industry’s growth trajectory rather than derail it. Assuming a durable resolution to the Middle East conflict, operational and under-construction liquefaction capacity is projected to top 700 million tonnes by 2030 — a 40% jump from 2025 levels. That wave of supply is expected to outpace demand growth in the near term, pushing prices down toward the low end of what US Gulf Coast production can profitably support, before the market tightens again from around the mid-2030s.
Longer term, the fundamentals look intact: population growth, urbanization, electrification, and the rise of power-hungry data centers are all expected to keep gas demand climbing, with LNG valued for its flexibility alongside renewables. But the report also flags real risks — geopolitical chokepoints beyond Hormuz (the Suez Canal, the Panama Canal), policy swings in exporting nations balancing energy security against price volatility, and the sheer cost pressure now facing new US projects as domestic gas inventories tighten.
The Bottom Line
LNG entered 2026 as a maturing, more liquid, more diversified market — better equipped to absorb shocks than it was during the 2022 crisis. But the Strait of Hormuz closure is a reminder that the industry’s “shock absorber” role in global energy security cuts both ways: the same infrastructure that delivers secure, flexible gas to the world remains exposed to the world’s most volatile geography. How quickly the Gulf stabilizes will shape LNG pricing, project timelines, and the pace of new investment for the rest of the decade.