If you’ve ever ventured into the world of online trading forums or tried to learn technical analysis, you’ve undoubtedly encountered the term “Price Action.” And if your immediate reaction was, “I looked it up and don’t really understand how this is a strategy, or what it is,” you are not alone. There is a lot of confusion.
The term is often thrown around as a magical key to market success, but its meaning remains frustratingly vague for many. Is it drawing lines? Reading candlesticks? A feeling? The truth is, it’s a blend of all these things and more.
This guide will cut through the noise. We’ll explore what price action truly is, break down its core components, address its controversies, and provide you with actionable strategies to start building your own trading approach.

What Exactly Is Price Action? (Spoiler: It’s Not an Indicator)
At its simplest, price action is the movement of a security’s price plotted over time. It is the raw, unfiltered story of the market, told through peaks, troughs, and consolidations. It forms the bedrock of all technical analysis.
Think of it this way:
- Price Action is the data source. It’s the “what.”
- Technical Indicators (like Moving Averages or RSI) are derivatives. They are calculations based on past price action. They are the “so what?”
Many traders, especially swing and day traders, rely almost exclusively on price action, believing that all known and unknown market factors—from fundamentals to mass psychology—are already reflected in the current price.
The Great Confusion: Why Everyone Defines Price Action Differently
The provided text highlights a crucial point: “Price action intentionally doesn’t have a very well-defined definition so that it can mean whatever the marketer wants.” This ambiguity is both a strength and a weakness.
In practice, “price action” can refer to any of the following, often in combination:
- Candlestick Patterns: Reading single or multi-candle formations like Dojos, Hammers, Engulfing patterns, and Pin Bars to gauge short-term sentiment.
- Chart Patterns: Identifying larger structures like Pennants, Flags, Head and Shoulders, and Double Tops that form over time.
- Bar Behavior (Al Brooks/PATS): A micro-analysis of how price behaves within and between individual bars, focusing on concepts like “first entry” and “second entry” signals.
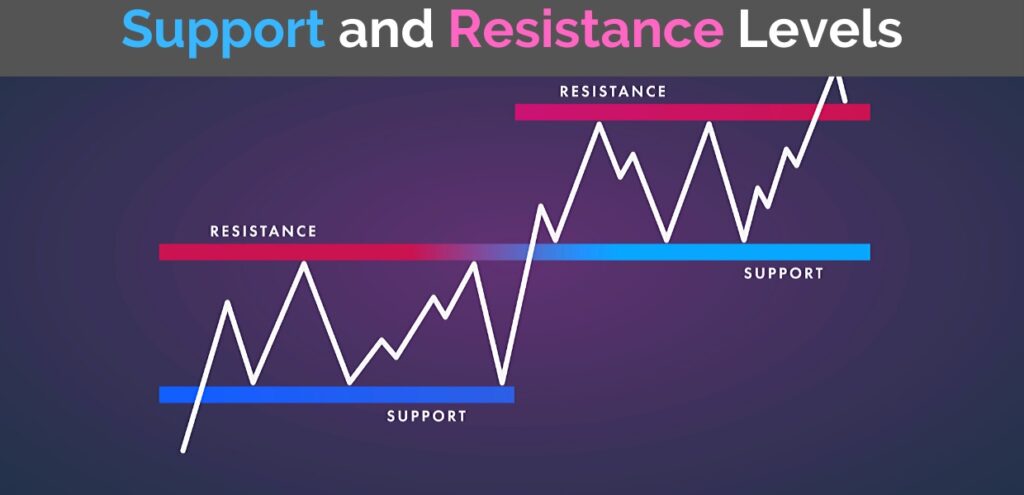
- Support & Resistance Dynamics: Analyzing how price reacts at key horizontal or diagonal levels, including concepts like Order Blocks and Supply & Demand zones.
- Market Structure: Understanding the relationship of price to higher-time-frame structures like Higher Highs, Lower Lows, and breakouts.
Ultimately, price action is a subjective assessment of what the chart is telling you. It’s pattern recognition. Your brain is wired to find patterns in chaos, just as you can identify both a maple and a pine tree as a “tree.” Price action trading is the skill of categorizing market movements to predict with a degree of probability what might happen next.
The Core Philosophy of Price Action Trading
Before diving into strategies, internalize these three fundamental principles:
- Price Action Discounts Everything: Focus solely on the chart. The price movement incorporates all known information, fundamentals, and trader psychology. Trade what you see, not what you think.
- Price Moves in Trends: “The trend is your friend.” Once a trend is established, it is more likely to continue than reverse. Your primary goal is to identify and trade in the direction of the prevailing trend.
- History Repeats Itself: Chart patterns that worked 100 years ago still appear today because they are rooted in consistent human psychology—primarily fear and greed.
Price Action vs. Indicators: The Great Debate
A core tenet for many price action purists is avoiding lagging, smoothing indicators. They argue that by the time an indicator gives a signal, the price move has already occurred.
However, a more pragmatic approach often wins. The most effective systems often arise from a combination of price action and indicators.
Why? Indicators can:
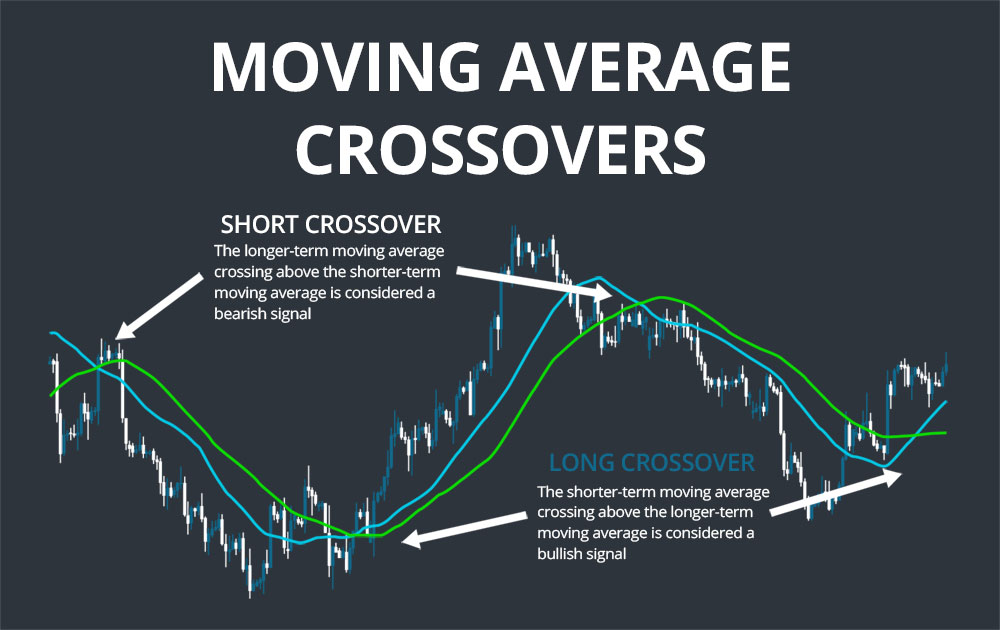
- Filter Noise: A moving average can help define a trend clearly, filtering out minor, irrelevant price wiggles.
- Identify Momentum: An oscillator can confirm the strength behind a price action breakout.
- Provide Profit Targets: Fibonacci extensions or Average True Range (ATR) can offer logical places to take profits.
Don’t fall into dogmatic traps. Use tools that enhance your reading of the price story.
Simple Yet Powerful Price Action Strategies
The beauty of price action is that the best strategies are often the simplest. Here are some foundational setups.
1. Trading with Candlestick Patterns
Candlestick charts are the preferred tool for price action traders due to their visual clarity. Key patterns include:
- The Pin Bar: A reversal pattern with a long wick and small body. A bullish pin bar rejects lower prices; a bearish pin bar rejects higher prices.
- The Engulfing Pattern: A strong reversal signal where the body of one candle completely “engulfs” the body of the previous candle. A bullish engulfing suggests a shift from selling to buying pressure.
- The Inside Bar: A pattern of indecision where a candle forms completely within the range of the previous candle. It often signifies consolidation before a significant breakout.
2. Trading with Chart Patterns
These patterns provide a bigger-picture view of market structure.
- Head and Shoulders: A reliable trend reversal pattern that signals a bullish trend is likely ending and a bearish trend is beginning.
- Double Tops & Bottoms: These form after a sustained trend and indicate a potential reversal. A double top has two distinct peaks at a similar level, while a double bottom has two distinct troughs.
- Triangle Patterns: These are typically continuation patterns.
- Symmetrical Triangle: A coil of lower highs and higher lows, often leading to a powerful breakout.
- Ascending Triangle: A bullish pattern with a flat top and rising bottom, indicating accumulation.
- Descending Triangle: A bearish pattern with a flat bottom and falling top, indicating distribution.
3. Combining Elements: Building Your System
The true power of price action emerges when you combine these elements to create a robust, personalized trading system. Here are two examples:
- Example 1: Trendline + Candlestick
In a clear uptrend, price pulls back and touches the ascending trendline. At the point of contact, a bullish Pin Bar forms, rejecting the lower prices. This confluence provides a high-probability entry to go long. - Example 2: Moving Average + Pattern
Price is trading below a key moving average (e.g., the 50 EMA), confirming a downtrend. It then retraces to test the moving average from below and forms a Bearish Engulfing candlestick. This shows the downtrend is resuming, offering a short entry.
The Crucial Limitations and Realities
It’s vital to approach price action with a clear understanding of its limitations:
- It’s Highly Subjective: Two traders can look at the same chart and see completely different things—one a bearish reversal, the other a buying opportunity.
- The Timeframe Matters: A stock can be in a downtrend on a 5-minute chart while being in a solid uptrend on a daily chart.
- Past Performance ≠ Future Results: A high-probability setup is still a speculative bet. There are no guarantees.
- It’s Your Unique Edge: The weird part is, the patterns you see and trust may be invisible to others. This is why a trader with a proven edge often struggles to explain it. Your brain navigates the market chaos in its own unique way.
The Bottom Line: Is Price Action for You?
Price action trading is not a holy grail. It is a skill—a way of interpreting the market’s language. It empowers you to develop a rule-based system that can consistently generate profits over time, not win every single trade.
If you feel overwhelmed by conflicting indicators or want to understand the “why” behind market moves, embracing price action is your path forward. Start simply. Learn one candlestick pattern. Understand one chart formation. Practice drawing support and resistance. Combine them slowly, backtest your ideas, and, as the text wisely suggests, always prioritize risk management.
By doing so, you will stop seeing chaotic wiggles on a screen and start reading the story of buyer vs. seller—a story that, while never simple, you can learn to understand.