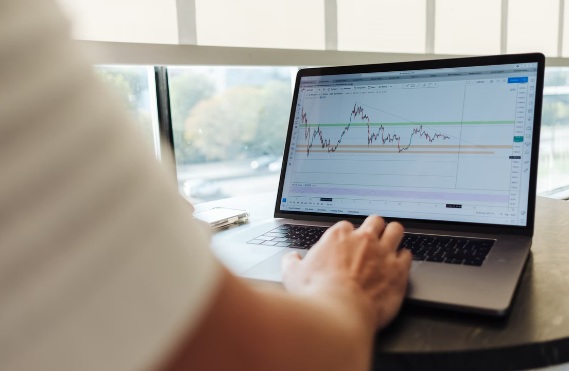
Technical analysis can be used to make more informed decisions on the financial markets. Technical analysis is a way of forecasting the future direction of the prices of stocks, currencies, or commodities by analyzing their past price movements. With some basic training on what to look for when doing your research, you will be able to spot patterns that offer clues on what will happen in the future. It’s important to not only look at the current prices but go back in history and review previous highs and lows as well.

Understanding Technical Indicators
Technical indicators are a way of taking the information that you have and using it to make a more informed decision. There are several different types of technical indicators, including support/resistance levels, moving averages, momentum oscillators, and volume. These can be used by themselves or in combination with others to try to predict future movements on any type of market. For example, support and resistance levels are areas on a price chart where investors believe that the stock will stop before falling further. The support level is the lowest price that the stock has reached in recent years, whereas the resistance level is the highest price that it has reached before falling again. These levels are derived by finding past highs and lows and projecting them forward to predict future trading patterns. By noting when these levels have been broken in the past, you can determine whether they will be broken again to make more profitable trades than if you simply relied on predictions alone. When technical indicators start moving against each other, but then move back together again, this is often referred to as a “golden cross” and can indicate future growth in the price of the security.
Smoothing Out Price Data
Moving averages are used for smoothing out price data so that it’s easier to see trends over time. On a chart, you will want to look for a shorter-term (e.g., fifty days) crossing over a longer-term (e.g., two hundred days). This is known as a “golden cross”. When the shorter-term MA moves back under the longer-term, this is called a “dead cross” and can be an indication that prices may start dropping rapidly again. Momentum oscillators measure the velocity and magnitude of price movements over a certain period. Price movements on all markets are cyclical, whether they rise or fall. By measuring the speed and direction of these price movements over time and then comparing that data to what you see at other times in history, you can determine which periods will be more favourable for investments than others.
Using Technical Analysis To Make Better Decisions
While it may seem intimidating to take a look at charts and graphs every day, learning how to analyze them properly is an extremely valuable skill. As mentioned above, when your analysis focuses not only on current prices but also looks back in history over several months or years (depending upon the market), you will be able to make better decisions when it comes time to invest. These technical indicators can tell when security has passed the point where it will start to gain price momentum, or when it has dropped so low that there’s no way for the price to go but up.
Example
If you were looking at charts on a stock that had previously seen $20 highs and $5 lows in recent years, you might expect to see some volatility there at some point. If the price broke below $10 once before and remained under $15 for an extended period, this is called support. Now, if at another time in history (perhaps 6 months ago) the stock started trading above $15 before eventually dropping back down again with strong volume, this is considered resistance. The next time around when these patterns come together again, this can be an indicator that a bounce off of this resistance level may very well continue going forward.
Golden and Dead Cross
When these indicators start moving against each other but then move back together again, it’s called a “golden cross”. This type of momentum is often considered to be the beginning of an uptrend for prices. A “dead cross” can also occur at times when there are sudden losses in momentum, which is usually an indicator that prices will likely fall even lower shortly after.

Using technical analysis can help you make more informed decisions about where to invest your money, and provide some insight into whether the time is right for stocks or commodities (or anything else). If history has shown us anything though, it’s that markets do fluctuate with change over time. By taking into account historical data and using graphs and charts to illustrate your findings, you can increase the likelihood of making better investments over time.