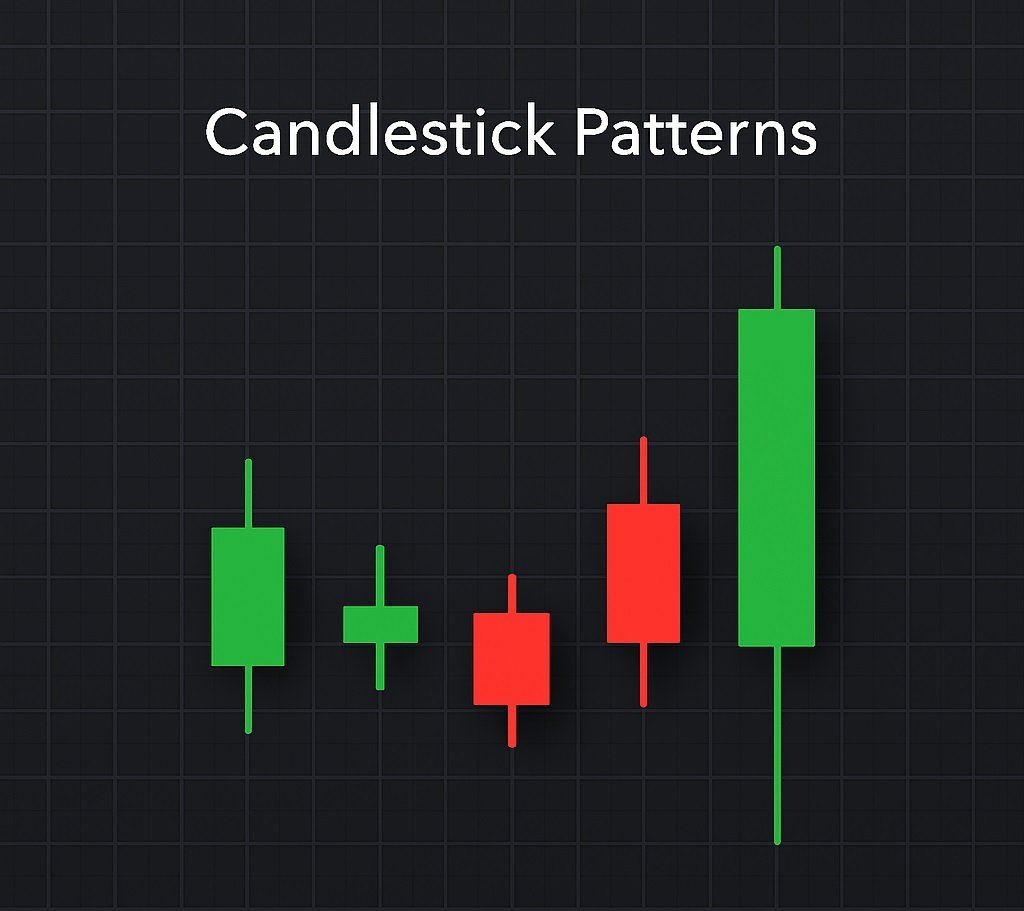
If you’ve ever dipped a toe into the world of trading, you’ve seen them: the elegant, centuries-old candlestick patterns. Promising to reveal market sentiment and predict price reversals with a single glance, they are the bedrock of many a day trader’s strategy.
But do they actually work? Or are they, as one physicist-turned-trader put it, “too good to be true BS”?
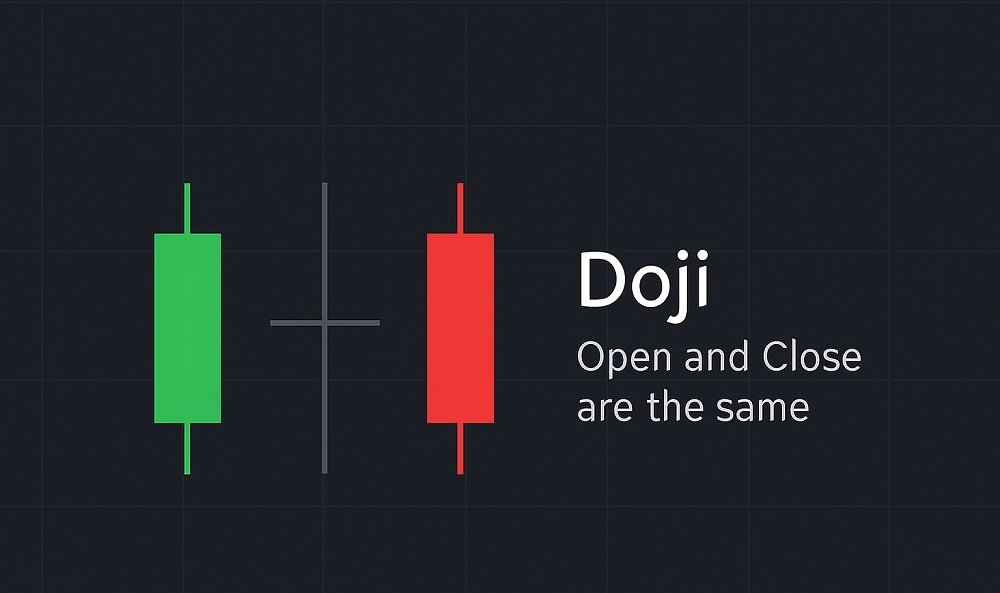
As someone with a background in physics and mathematics, my first instinct was skepticism. The financial markets are a chaotic system, a storm of noise with billions of transactions from millions of participants. Can something as simple as a “Doji” or “Hammer” candle truly cut through that chaos? This post is the result of that investigation, merging market lore with a rigorous, evidence-based perspective.
The Allure and The Argument: Why Candlesticks Are So Popular
At their core, candlestick patterns are a brilliant form of data visualization. They efficiently convey the open, high, low, and close of a trading period. The patterns themselves—like the Bullish Engulfing or Evening Star—are meant to encapsulate a psychological battle between buyers and sellers.
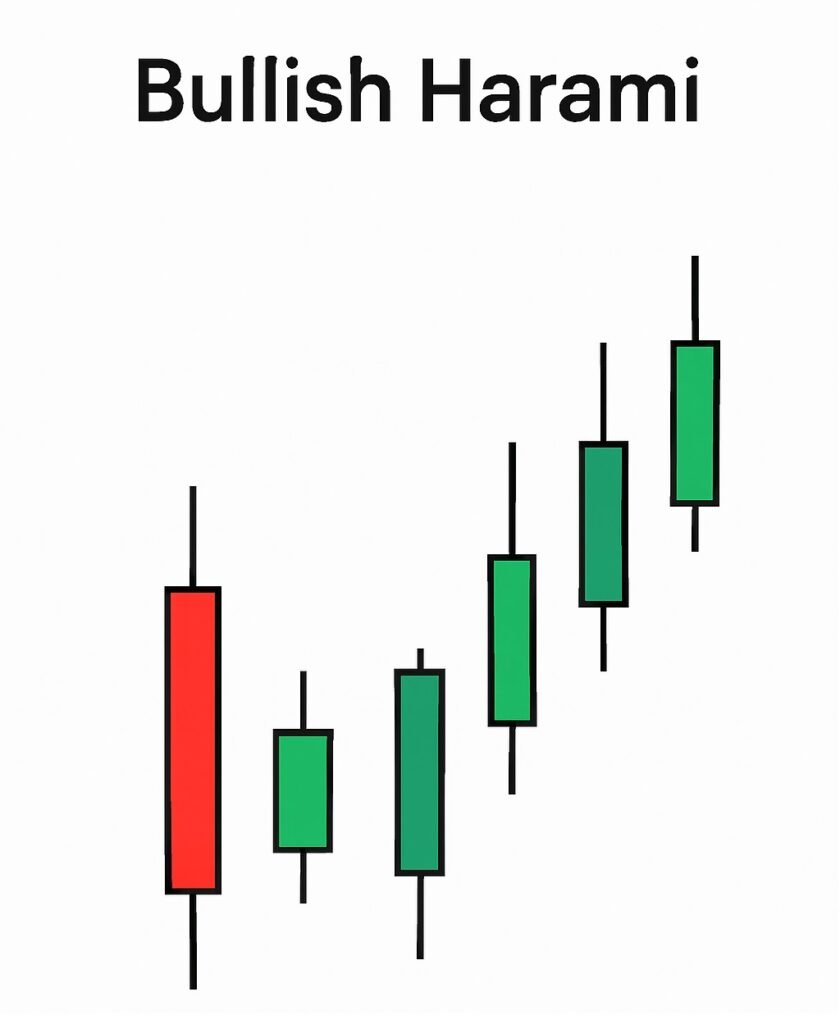
The compelling argument for their validity is a psychological feedback loop. These patterns are now deeply entrenched in trading education. Countless brokers build automatic pattern recognition into their platforms. When thousands of traders and algorithms see a “Bearish Harami” forming simultaneously, they might all sell for the same reason—making the predicted drop a reality.
In essence, if enough traders “vote” using the same candlestick playbook, the market can, for a brief moment, behave as the playbook predicts.
The Skeptic’s Corner: A Physicist’s Dose of Reality
This is where the scientific mind starts asking uncomfortable questions.
- The Arbitrage Problem: If these patterns were so reliably profitable, wouldn’t the multi-billion dollar quant funds with their supercomputers and PhD-laden research teams have arbitraged them away in microseconds? The sheer scale of institutional trading makes it hard to believe a simple retail-trader pattern offers any durable edge.
- The Lack of Statistical Rigor: As noted in the seminal book “Evidence-Based Technical Analysis“, when subjected to rigorous statistical testing, most conventional technical analysis—including candlestick patterns—fails miserably. Many trading gurus show a handful of cherry-picked charts to “prove” their strategy, but where is the large-scale, statistically significant backtest?
- The “Market Mechanic” vs. The “Market Engineer”: This is a crucial distinction. Relying solely on candlesticks is like being a mechanic who can change a part by memorizing diagrams but doesn’t understand the underlying physics of the engine. You’re working with ad-hoc heuristics, not a deep, coherent theory. Do you want to be the mechanic, or the engineer who designed the engine?
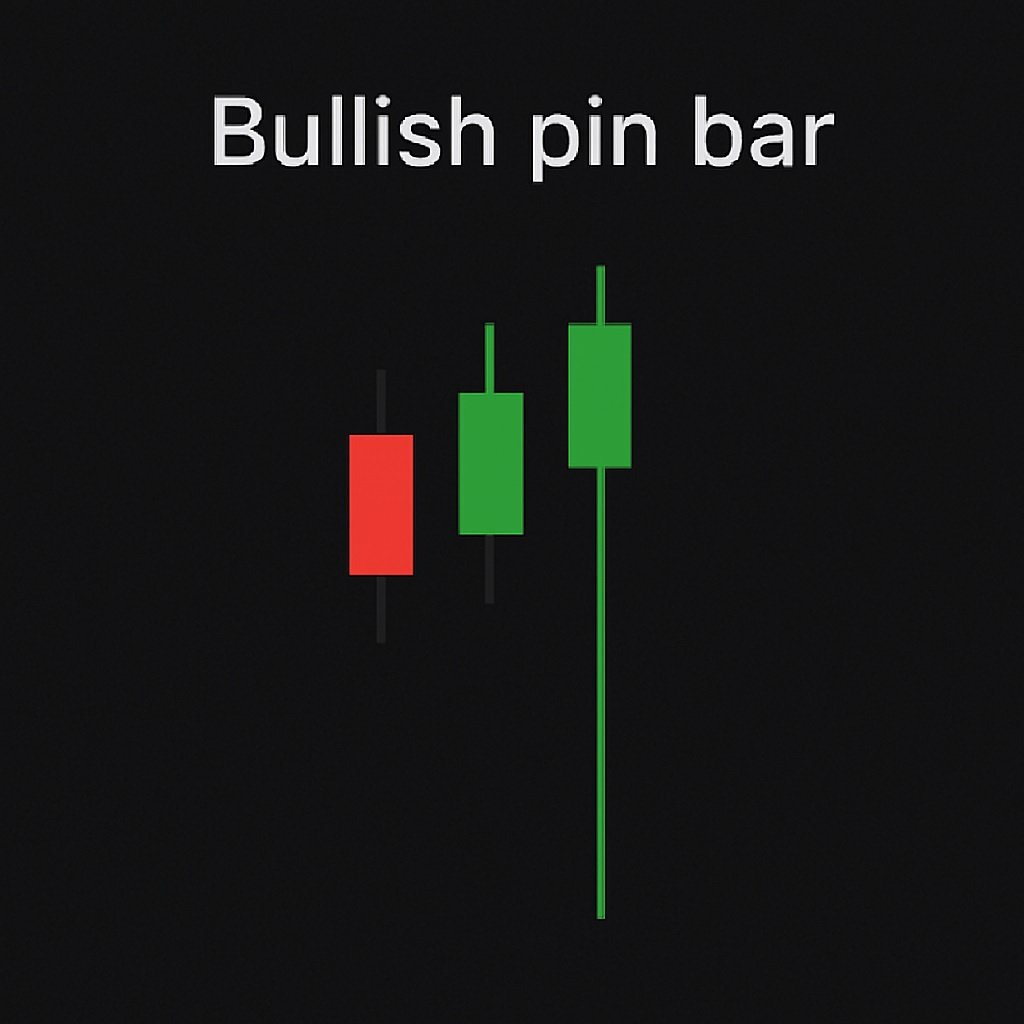
Bridging the Gap: From Naive Pattern Recognition to Robust Systems
So, is the answer to abandon candlesticks entirely? Not necessarily. The key is to stop treating them as a standalone signal and start asking a more profound question:
“What is the underlying market behavior this pattern is trying to represent?”
Let’s take the Doji. It represents indecision, a potential reversal. On its face, that’s reasonable. But is it valid to trade on the shape alone?
A more systematic approach would be to hypothesize and test:
- Does volume matter? A Doji on low volume might be noise; a Doji on exceptionally high volume signals a true battle.
- What about the context? Is it forming at a key support/resistance level or a pivot point?
- Can we deconstruct it? Instead of just the candle’s shape, could we analyze the Level II order book data that formed the Doji to find a more precise signal?
This is where your quantitative background becomes a superpower. Computers don’t need these visual abstractions. They can find complex, multi-dimensional patterns invisible to the human eye. The goal isn’t to code a “Hammer” recognizer, but to build a model that identifies the conditions of supply and demand that a Hammer imperfectly represents.
The Path Forward: Evolving Beyond 19th-Century Heuristics
The consensus from the sharpest minds in econophysics and quantitative finance is clear: the heuristics of 19th-century traders are insufficient for the 21st-century global market.
As Benjamin Graham wisely said, “In the short run, the market is a voting machine but in the long run, it is a weighing machine.” Candlestick patterns might help you hear the short-term “vote,” but long-term profitability comes from “weighing” the market with deeper tools.
Your action plan should be:
- Acknowledge the Psychology: Understand that candlestick patterns can influence crowd behavior, but don’t confuse that with a fundamental edge.
- Layer Your Approach: Never use a candlestick pattern alone. Combine it with volume, momentum indicators, volatility forecasts, and key support/resistance levels.
- Embrace the Rigor: Move from being a “pattern spotter” to a “model builder.” Dive into books on econophysics and evidence-based trading. Use your math/physics skills to model market structure itself.
- Backtest Everything: Any pattern or strategy must be subjected to rigorous, long-term backtesting across different market conditions. If it doesn’t hold up statistically, it’s not a strategy—it’s a story.
Conclusion
Candlestick patterns are not a magic key to the markets. They are a piece of the puzzle—a potentially useful, but often overhyped, component. They work best not because of some inherent market magic, but because people believe they work.
The future of successful trading, especially for those with a quantitative mindset, lies not in memorizing candle shapes but in building sophisticated, multi-factor models that understand the underlying mechanics of the market. Stop being the mechanic tinkering in the dark. Become the engineer who designs the system.
Have you successfully integrated candlestick patterns into a more complex algo? Or have you abandoned them entirely? Share your data-driven experiences in the comments below.
Please read the following disclaimer carefully before using any information in this article.
1. No Financial Advice: The content provided in this article, including all text, analyses, and opinions, is published for informational and educational purposes only. It is not intended to constitute financial advice, investment recommendations, or trading advice of any kind. You should not construe any such information or other material as legal, tax, investment, financial, or other professional advice.
2. High Risk of Loss: Trading and investing in financial markets, including stocks, forex, cryptocurrencies, and derivatives, carries a high level of risk and may not be suitable for all investors. There is a possibility you could sustain a loss of some or all of your initial capital. You should be aware of all the risks involved and seek advice from an independent, qualified financial advisor before making any investment or trading decisions.
3. No Guarantee of Results: Past performance is not indicative of future results. The author has made every effort to ensure the accuracy of the information contained within this article at the time of writing. However, neither the author nor the publisher can guarantee the accuracy, completeness, or timeliness of the data or conclusions presented. There is no guarantee that any strategies, methods, or systems discussed will be profitable or will not result in losses.
4. Backtesting and Hypothetical Performance: Any mention of backtesting, historical data, or hypothetical performance results has inherent limitations. Unlike an actual performance record, these results do not represent real trading and are often created with the benefit of hindsight. They do not account for the impact of financial risk in actual trading, such as liquidity, slippage, and transaction costs.
5. Your Responsibility: All investment and trading decisions you make are your sole responsibility. You must conduct your own research and due diligence before executing any trades. The author and publisher of this article will not be liable for any loss or damage caused by your reliance on the information contained herein.
By accessing this article, you acknowledge and agree that you are using the information at your own risk.